Free Cash Flow to Equity (FCFE): Formula
FCFE measures the cash available to shareholders after operating costs, reinvestment, and all debt-related flows — the equity counterpart to FCFF.
Key Takeaways
- FCFE is the cash that could, in principle, be paid out to shareholders after the business has funded operations, reinvestment, and its obligations to lenders.
- Because debt flows are included, FCFE pairs with the cost of equity and produces equity value directly — no subtracting net debt at the end.
- Net borrowing is the ingredient that separates FCFE from simple free cash flow: new debt adds distributable cash today, repayments consume it.
- FCFE works best when leverage is stable; for companies actively changing their capital structure, firm-level FCFF is usually the cleaner tool.
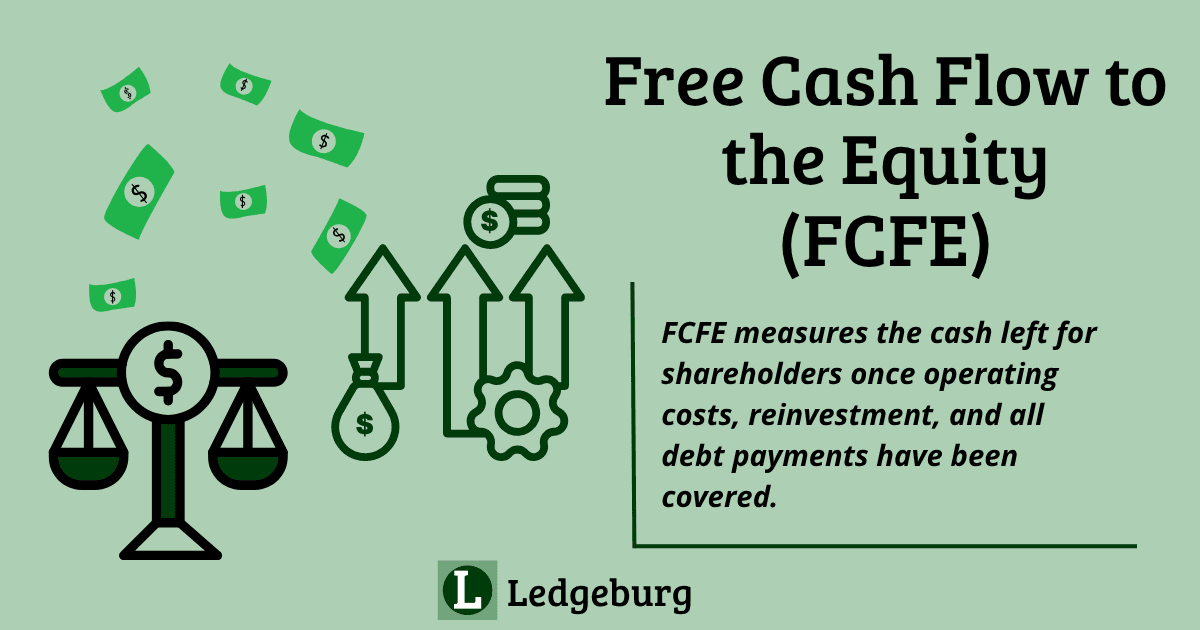
Every valuation question eventually reduces to one of two perspectives: what is the whole business worth, or what is the shareholders' slice worth? Free cash flow to the firm answers the first. Free cash flow to equity (FCFE) answers the second — it measures the cash a company could hand to its shareholders after operations are funded, reinvestment is made, and lenders have received everything they are owed.
That last clause is what gives FCFE its character. Interest payments and debt repayments come out; new borrowing goes in. What remains is the genuine distributable surplus — the theoretical ceiling on dividends and buybacks. This guide covers what FCFE includes, how to calculate it from three starting points, a worked example from Microsoft's filings, and when to prefer it over its firm-level sibling.
What Is Free Cash Flow to Equity?
Picture the cash waterfall of a business over a year. Revenue comes in; operating costs, taxes, and working-capital needs take their share. Capital expenditures fund the asset base. Then the lenders step up: interest is paid, maturing debt is repaid, and perhaps new debt is raised. Whatever cash survives the full sequence belongs to shareholders — that residual is FCFE.
Two properties follow directly. First, FCFE is a levered measure: the company's financing choices are inside the number, not stripped out. A heavily indebted firm and a debt-free firm with identical operations will show very different FCFE, which is precisely the point — shareholders of the two firms are in very different positions.
Second, FCFE is a measure of capacity, not behavior. A company with $20B of FCFE that pays $5B in dividends has made a capital-allocation choice, and the gap between the two numbers is often more informative than either figure alone.
The FCFE Formula
The most direct route starts from cash flow from operations, which already reflects interest paid, taxes, non-cash charges, and working-capital movements:
Because operating cash flow sits after interest on the cash flow statement, no interest adjustment is needed — the lenders' running cost is already inside CFO. Only the principal flows require the explicit net borrowing term.
Starting from Net Income
Building up from the bottom line exposes the full anatomy:
Net income already bears the after-tax cost of interest, so as with the CFO route, only principal movements need the adjustment.
Starting from FCFF
When a firm-level number already exists, converting is two steps — remove what lenders receive, add what they provide:
This bridge formula is worth internalizing because it makes the difference between the two measures explicit: after-tax interest and net borrowing are the only items separating them. Any disagreement beyond those two lines means an error somewhere.
Calculating FCFE: Microsoft Example
Microsoft's 10-K for fiscal year 2024 (ended June 30, 2024) provides the inputs for the direct route:
| Input | Amount | Where to find it |
|---|---|---|
| Cash flow from operations | $118.5B | Cash flow statement |
| Capital expenditures | $44.5B | Cash flow statement, investing section |
| Debt repayments (net of issuance) | ~$2.9B | Cash flow statement, financing section |
Applying the formula:
Roughly $71 billion was available to Microsoft's shareholders in fiscal 2024 after the business funded itself and serviced its debt. Set that against what the company actually distributed — about $22B in dividends plus buybacks — and the capacity-versus-behavior distinction becomes concrete: Microsoft returns a fraction of its FCFE and retains the rest, largely to fund the AI infrastructure build-out consuming an ever-larger share of operating cash.
Note the direction of the borrowing term. Microsoft repaid more debt than it raised, so net borrowing is negative and FCFE lands below the simple CFO-minus-CapEx figure. For a company in a borrowing phase the sign flips — and that is where FCFE demands the most skepticism, because debt-funded distributable cash is real this year and gone the next.
FCFE in Valuation
FCFE powers the equity-side DCF: forecast FCFE over an explicit horizon, apply a terminal assumption, and discount everything at the cost of equity — not WACC. The sum is equity value directly; divide by shares outstanding for intrinsic value per share. No enterprise-value detour, no net-debt subtraction at the end, because debt was handled inside the cash flows.
The FCFE model is also the natural successor to dividend discount models. The Gordon Growth Model values a stream of dividends — elegant, but silent on companies that pay little relative to what they could. Substituting FCFE for dividends values what shareholders could receive rather than what managers currently choose to pay, which extends the DCF framework to the majority of modern companies whose payout policy understates their distributable cash.
| FCFE model | Dividend discount model | |
|---|---|---|
| Values | Distribution capacity | Actual distributions |
| Works for | Most profitable companies | Mature, high-payout companies |
| Weakness | Requires debt-schedule forecasting | Ignores retained distributable cash |
When to Use FCFE vs. FCFF
The practical decision rule turns on capital structure:
- Stable leverage → FCFE. When debt levels move predictably with the business, forecasting net borrowing is straightforward and the direct-to-equity route saves a step.
- Changing leverage → FCFF. LBO candidates, deleveraging balance sheets, firms funding acquisitions with debt — forecasting their net borrowing year by year is guesswork stacked on guesswork. Value the enterprise with FCFF at WACC, then subtract net debt once.
- Comparing across companies → FCFF. Leverage differences contaminate FCFE comparisons; the firm-level measure puts operators side by side.
Limitations and What to Watch
- Net borrowing volatility. Debt issuance and repayment are lumpy — refinancing years, acquisition years, maturity walls. A single year of FCFE says little; normalize over several, or model the debt schedule explicitly.
- Borrowed distributions. Rising FCFE driven by net borrowing rather than operations is a warning, not a strength. Decompose the growth: operating cash, reinvestment, or leverage?
- Buyback-era relevance. FCFE was conceived when dividends dominated. Buybacks now carry most shareholder returns, which makes FCFE more useful — it captures total capacity regardless of the distribution mechanism — but comparisons against dividend payout ratios alone will mislead.
- Same manipulation surface as FCFF. Working-capital timing games and the CapEx boundary distort both measures equally; the checks from the FCFF guide apply unchanged.